I love creating free content full of tips for my readers, you. I don't accept paid sponsorships, my opinion is my own, but if you find my recommendations helpful and you end up buying something you like through one of my links, I could earn a commission at no extra cost to you. Learn more
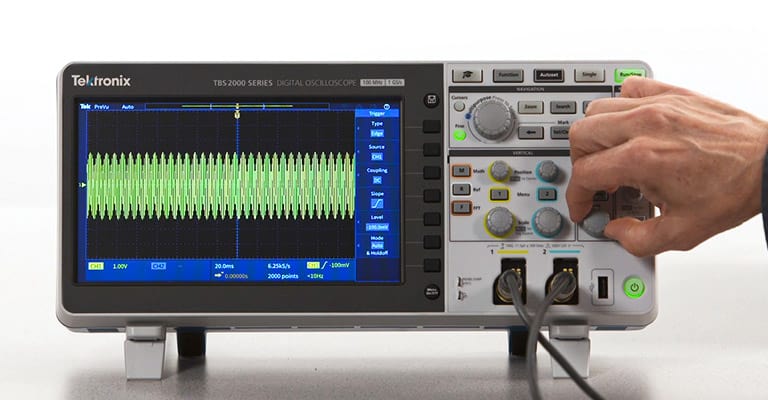
An oscilloscope measures the voltage supply of any source and displays a voltage vs. time graph on a digital screen attached to it. This graph is used in different fields of electrical engineering and medicine. Because of the accuracy and visual representation of the data, oscilloscopes are a widely used device.
At first glance, it may seem nothing special but it can be very useful in understanding how a signal is behaving. Monitoring the constant change can help you find acute details that were impossible to find out without a live graph. We will teach you to read an oscilloscope screen for some common medical and engineering purposes.
In this post we'll cover:
Uses of an Oscilloscope
The use of an oscilloscope is mostly seen for research purposes. In electrical engineering, it provides a sensitive and precise visual representation of complex wave functions. Apart from the very basics, the frequency, and the amplitude, they can be used to study for any noises on circuits. The shapes of the waves can be viewed too. In the field of medical science, oscilloscopes are used to perform different tests on the heart. The constant change of the voltage with time is translated to the beating of the heart. Looking at the graph on the oscilloscopes, doctors can deduce crucial information regarding the heart.
Reading an Oscilloscope Screen
After you’ve connected the probes to a voltage source and managed to get an output on the screen, you should be able to read and understand what that output means. The graphs mean different things for engineering and medicine. We will help you understand both by answering some of the most common questions.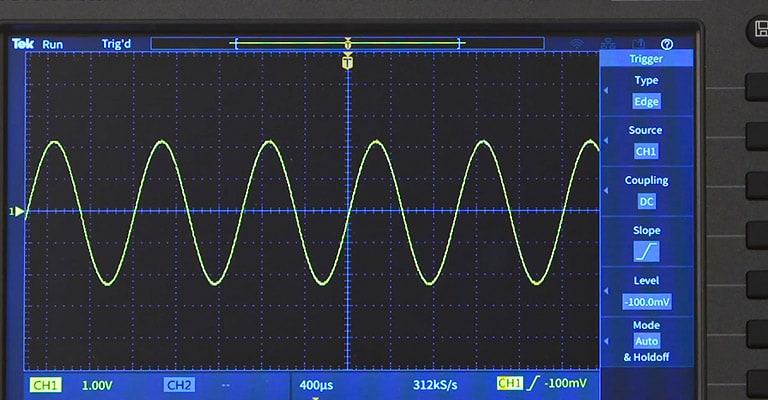
How to Measure AC Voltage with Oscilloscope?
Alternating current source or AC voltage changes the direction of flow concerning time. So, the graph obtained from an AC voltage is a sine wave. We can calculate the frequency, amplitude, time period, noises, etc. from the graph.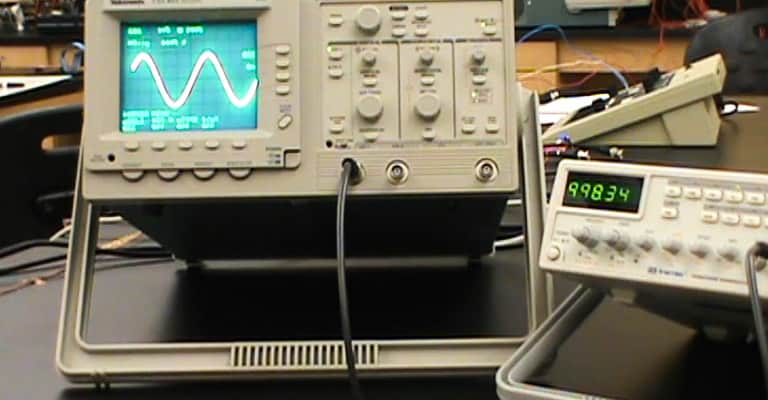
Step 1: Understanding the Scale
There are small square boxes on the screen of your oscilloscope. Each of those squares is called a division. The scale, however, is the value that you assign to an individual square, i.e. a division. Depending on what scale you set on both axes your readings will vary, but they will translate to the same thing in the end.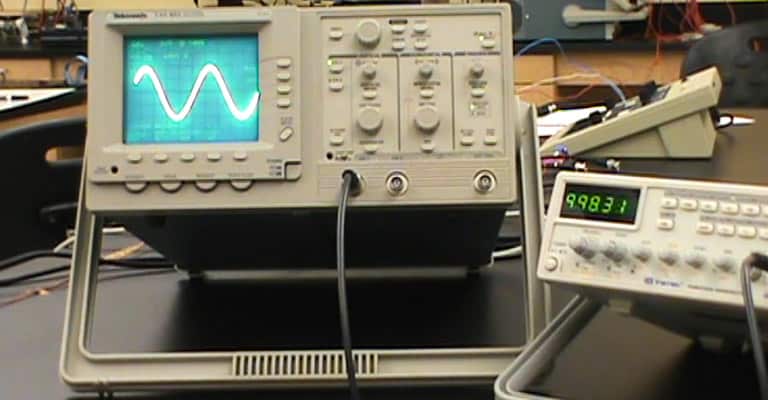
Step 2: Know the Vertical and the Horizontal Sections
Across the horizontal or X-axis, the values you’ll obtain indicate time. And we have the voltage values across the Y-axis. There is a knob at the vertical section for setting the voltages per division (volts/div) value. There’s a knob at the horizontal section too which sets the time per division (time/div) value. Usually, the time values are not set in seconds. Milliseconds (ms) or microseconds are more common because the voltage frequency measured is usually ranged up to kilohertz (kHz). The voltage values are found in volts (v) or millivolts.
Step 3: Dial the Positioning Knobs
There are two other knobs, both on the horizontal and the vertical section of the oscilloscope, which lets you move the whole graph/ figure of the signal across the X and the Y-axis. This is can be very useful to get accurate data from the screen. If you want precise data from the graph, you can move the graph around and match it with the tip of a division square. This way, you can be sure of the division count. However, don’t forget to consider the lower part of the graph.
Step 4: Taking the Measurement
Once you’ve set the knobs to a reasonable state, you can start taking measurements. The highest vertical height that the graph will reach from the equilibrium is called the amplitude. Say, you have set the scale on the Y-axis as 1volts per division. If your graph reaches 3 smallest squares from the equilibrium, then its amplitude is 3volts.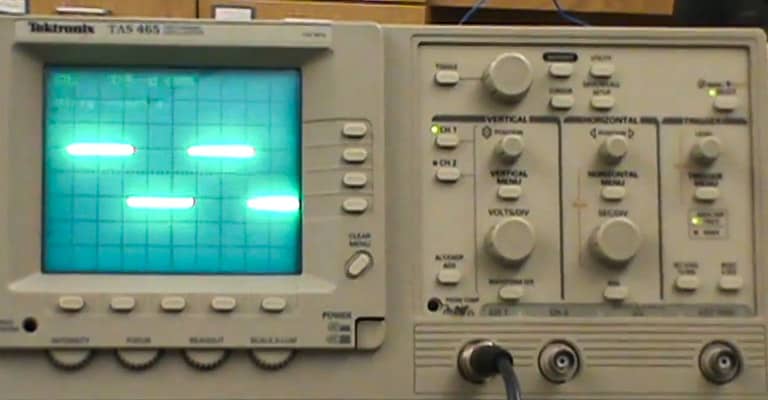
Why the Larger Waves Seen on the Oscilloscope
Some knobs on the vertical and the horizontal section can be dialed to change the scale of the graph. By changing the scale, you are zooming in and out. Because of a larger scale, say, 5units per division, larger waves will be seen on the oscilloscope.What is DC Offset on An Oscilloscope
If a wave’s mean amplitude, is zero, the wave is formed in such a way that the X-axis has the values of zero for the ordinate (Y-axis values). However, some waveforms are created above the X-axis or bellow the X-axis. That’s because their mean amplitude is not zero, but its more or less than zero. This condition is called DC offset.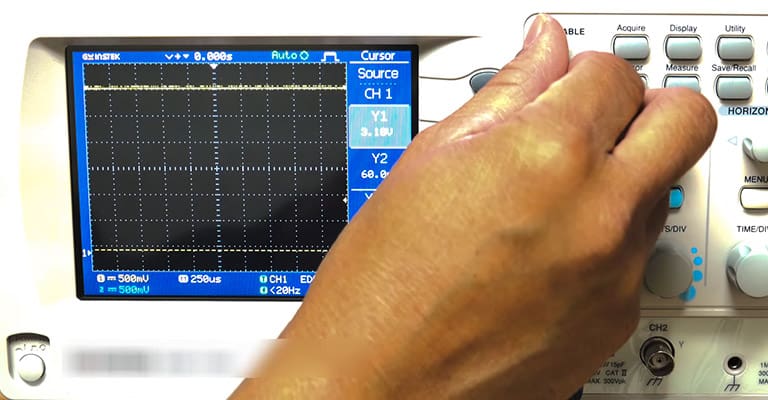
Why the Larger Waves Seen on the Oscilloscope Represent Ventricular Contraction
When larger waves are seen on the oscilloscope, it represents ventricular contraction. The waves are larger because the pumping action of the ventricles of the heart is much stronger than the atria. That’s because the ventricle pumps blood out of the heart, to the whole body. So, it requires a huge amount of force. Doctors monitor the waves and study the waves formed on the oscilloscope to understand the condition of the ventricles and the atria and ultimately, the heart. Any unusual shape or rate of the wave formation indicates heart problems which the doctors can tend to.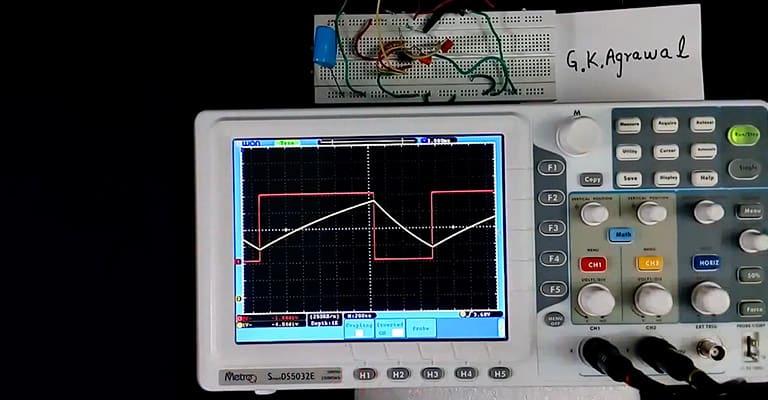
Check for Additional Information on Screen
Modern-day oscilloscopes show not only the graph but a set of other data too. The most common one of those data is the frequency. Since the oscilloscope gives data relative to a particular time, the frequency value may keep on changing concerning the time. The amount of change depends on the test subject. Companies that make top quality oscilloscopes are constantly trying to improve the user experience with their devices and push the boundary. With this goal in mind, they are putting a large number of extra settings for the device. Options to store a graph, run something over and over again, freezing the graph, etc. are some of the things whose info you might see on screen. As a beginner, being able to read and gather data from the graph is all you need. You don’t need to understand all of them at first. Once you get comfortable with it, start exploring the buttons and see what changes come on the screen.Conclusion
An oscilloscope is an important tool both in the field of medical science and electrical engineering. If you have any older models of oscilloscopes, we recommend you start with it first. It will be easier and less confusing to you if you begin with something basic.
I'm Joost Nusselder, the founder of Tools Doctor, content marketer, and dad. I love trying out new equipment, and together with my team I've been creating in-depth blog articles since 2016 to help loyal readers with tools & crafting tips.