Among the hundreds of tools available in the market for measuring information on a particular electric signal, two of the most common machines are the multimeter and the oscilloscope. But they have gone through tremendous changes over the years to be better and efficient at their job.
Although the job of these two devices is somewhat similar, they are not identical both in terms of operation and looks. They have some specific features that make them exclusive to some fields. We will tell you all the differences between these two devices so that you know which one will be more useful to you under different conditions.
Differentiating the Oscilloscope to a Graphing Multimeter
When you want to find the differences between two things, you just need to compare their features and find out which one does a better job for a particular task. And that is exactly what we did here. We did an extensive research and study on the factors that set these two machines apart, and listed those down for you below.
History of Creation
While the first moving-pointer device to be invented was the galvanometer in 1820, the first multimeter was invented in the early 1920s. British Post Office engineer Donald Macadie invented the machine being frustrated with the need to carry multiple devices required for maintenance of the telecom circuits.
The first oscilloscope was invented in 1897 by Karl Ferdinand Braun, who used the Cathode Ray Tube (CRT) to display the displacement of a constantly moving elector representing the nature of an electrical signal. After the second world war, oscilloscope kits were found on the market for about $50.
Bandwidth
Low-end oscilloscopes have a starting bandwidth of 1Mhz (MegaHertz) and reach up to a few MegaHertz. On the other hand, a graphing multimeter has a bandwidth of 1Khz (KiloHertz) only. More bandwidth equals to more scans per second which results in accurate and precise waveforms.
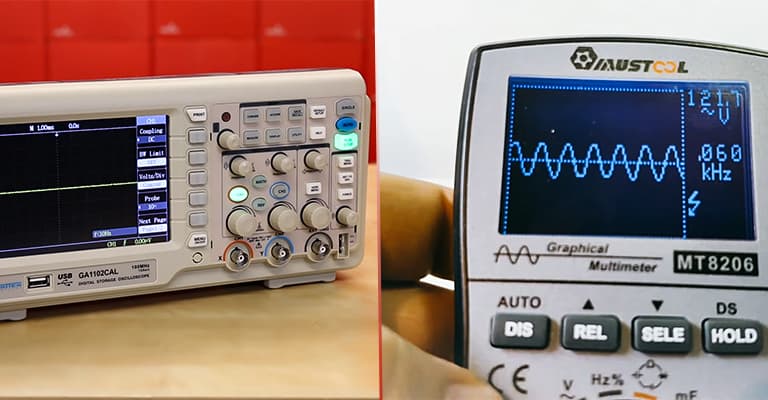
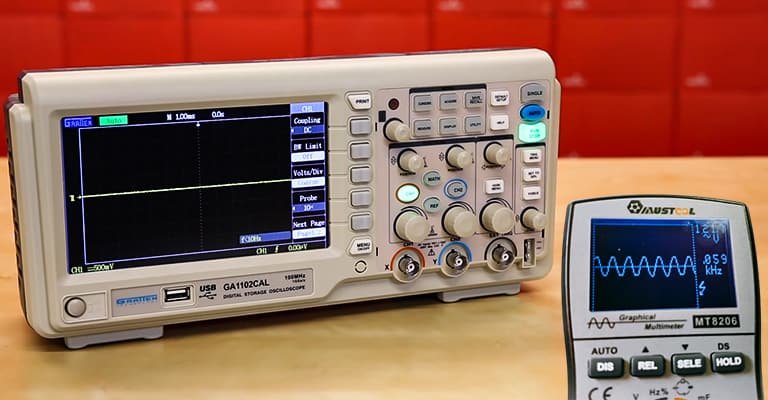
Outlooks: Size and Basic Parts
Oscilloscopes are lightweight and portable devices that look like a small box. Although there are some special purpose scopes which are rack-mounted. Graphing multimeters, on the other hand, are small enough to carry in your pocket.
The controls and the screen are on the left and right side of an oscilloscope. In an oscilloscope, the screen size is quite large compared to the small screen of a graphing multimeter. The screen covers about 50% of the device’s body in an oscilloscope. But on a graphing multimeter, it is about 25%. The rest is for controls and inputs.
Screen Properties
Oscilloscope screens are way bigger than that of a graphing multimeter. On the screen of an oscilloscope, there is a grid with small squares known as divisions. This provides versatility and flexibility like an actual graph sheet. But there are no grids or divisions in a graphing multimeter’s screen.
Ports for Input Jacks
Generally, there are two input channels on an oscilloscope. Each input channel receives an independent signal using the probes. In a graphing multimeter, there are 3 input ports labeled COM (common), A (for current), and V (for voltage). There is also a port for an external trigger in an oscilloscope which is absent on a graphing multimeter.
Controls
The controls in an oscilloscope is divided into two sections: the vertical and the horizontal. The horizontal section controls the attributes of the X-axis of the graph formed on the screen. The vertical section controls the Y-axis. However, there are no controls for controlling the graph in a graphing multimeter.
There is a big dial in a graphing multimeter that you have to turn and point at the thing you want to measure. For example, if you want to measure voltage difference, then you have to turn the dial to the “V” marked around the dial. These controls are located adjacent to the screen of an oscilloscope, right before the vertical section.
In a graphing multimeter, the default output is the value. To get the graph, you have to click on the “Auto” button just below the screen. Oscilloscopes will give you a graph by default. You can get additional information on the graph using the knobs on the vertical and the horizontal section as well as the panel adjacent to the screen.
Buttons for holding a value and releasing the value for new tests are located right after the “Auto” button. The buttons for storing results in an oscilloscope are normally found above the vertical section.
Types of Sweep
In an oscilloscope, you can customize your sweep for getting a graph under specific criteria that you can set. This is called triggering. Graphical multimeters don’t have this option and as a result, they don’t have different types of sweeps like oscilloscopes. Oscilloscopes help in research because of the triggering ability.
Screenshots
Modern oscilloscopes can take screenshot pictures of the graph that is being displayed on the screen, and store it for some other time. Not only that, that image can be transferred to a USB device too. None of these features are available in a multimeter. The best it can do is store the magnitude of something.
Storage
Mid to high-end oscilloscopes can store not only images, but they can also store live graphs of a certain time limit. This feature is not available on any graphing multimeter out on the market. Because of this feature, oscilloscopes are becoming more popular for research purposes, as they can store sensitive data for studying in the future.
Field of Use
Graphing multimeters are and can only be used in the field of electrical engineering. But oscilloscopes are being used in the field of medical science apart from electrical engineering. For example, an oscilloscope can be used to view the heartbeats of a patient and obtain valuable information related to the heart.
Cost
Oscilloscopes are way more pricy than graphing multimeters. Oscilloscopes normally start from $200 and onwards. On the other hand, graphing multimeters can be found for as cheap as $30 or $50.
To Sum it Up
Oscilloscopes have way more features than a graphing multimeter. Also, a graphing multimeter doesn’t even come close to an oscilloscope when it comes to the things it can do. With that being said, we can’t say that an oscilloscope beats the multimeter in every single category and you should only buy an oscilloscope.
Oscilloscopes are for research purposes. It will help find faults in a circuit that requires precise and sensitive waves. But, if your goal is to only find some magnitudes and take a look at what the waveform is, then you can easily use a graphing multimeter. It will not fail you in that regard.
You may read: How to Use an Oscilloscope

I'm Joost Nusselder, the founder of Tools Doctor, content marketer, and dad. I love trying out new equipment, and together with my team I've been creating in-depth blog articles since 2016 to help loyal readers with tools & crafting tips.